
GIS productivity platform that helps you get work done from anywhere on any device. Built for business, designed for teams.
GIS cartographic and analytics platform
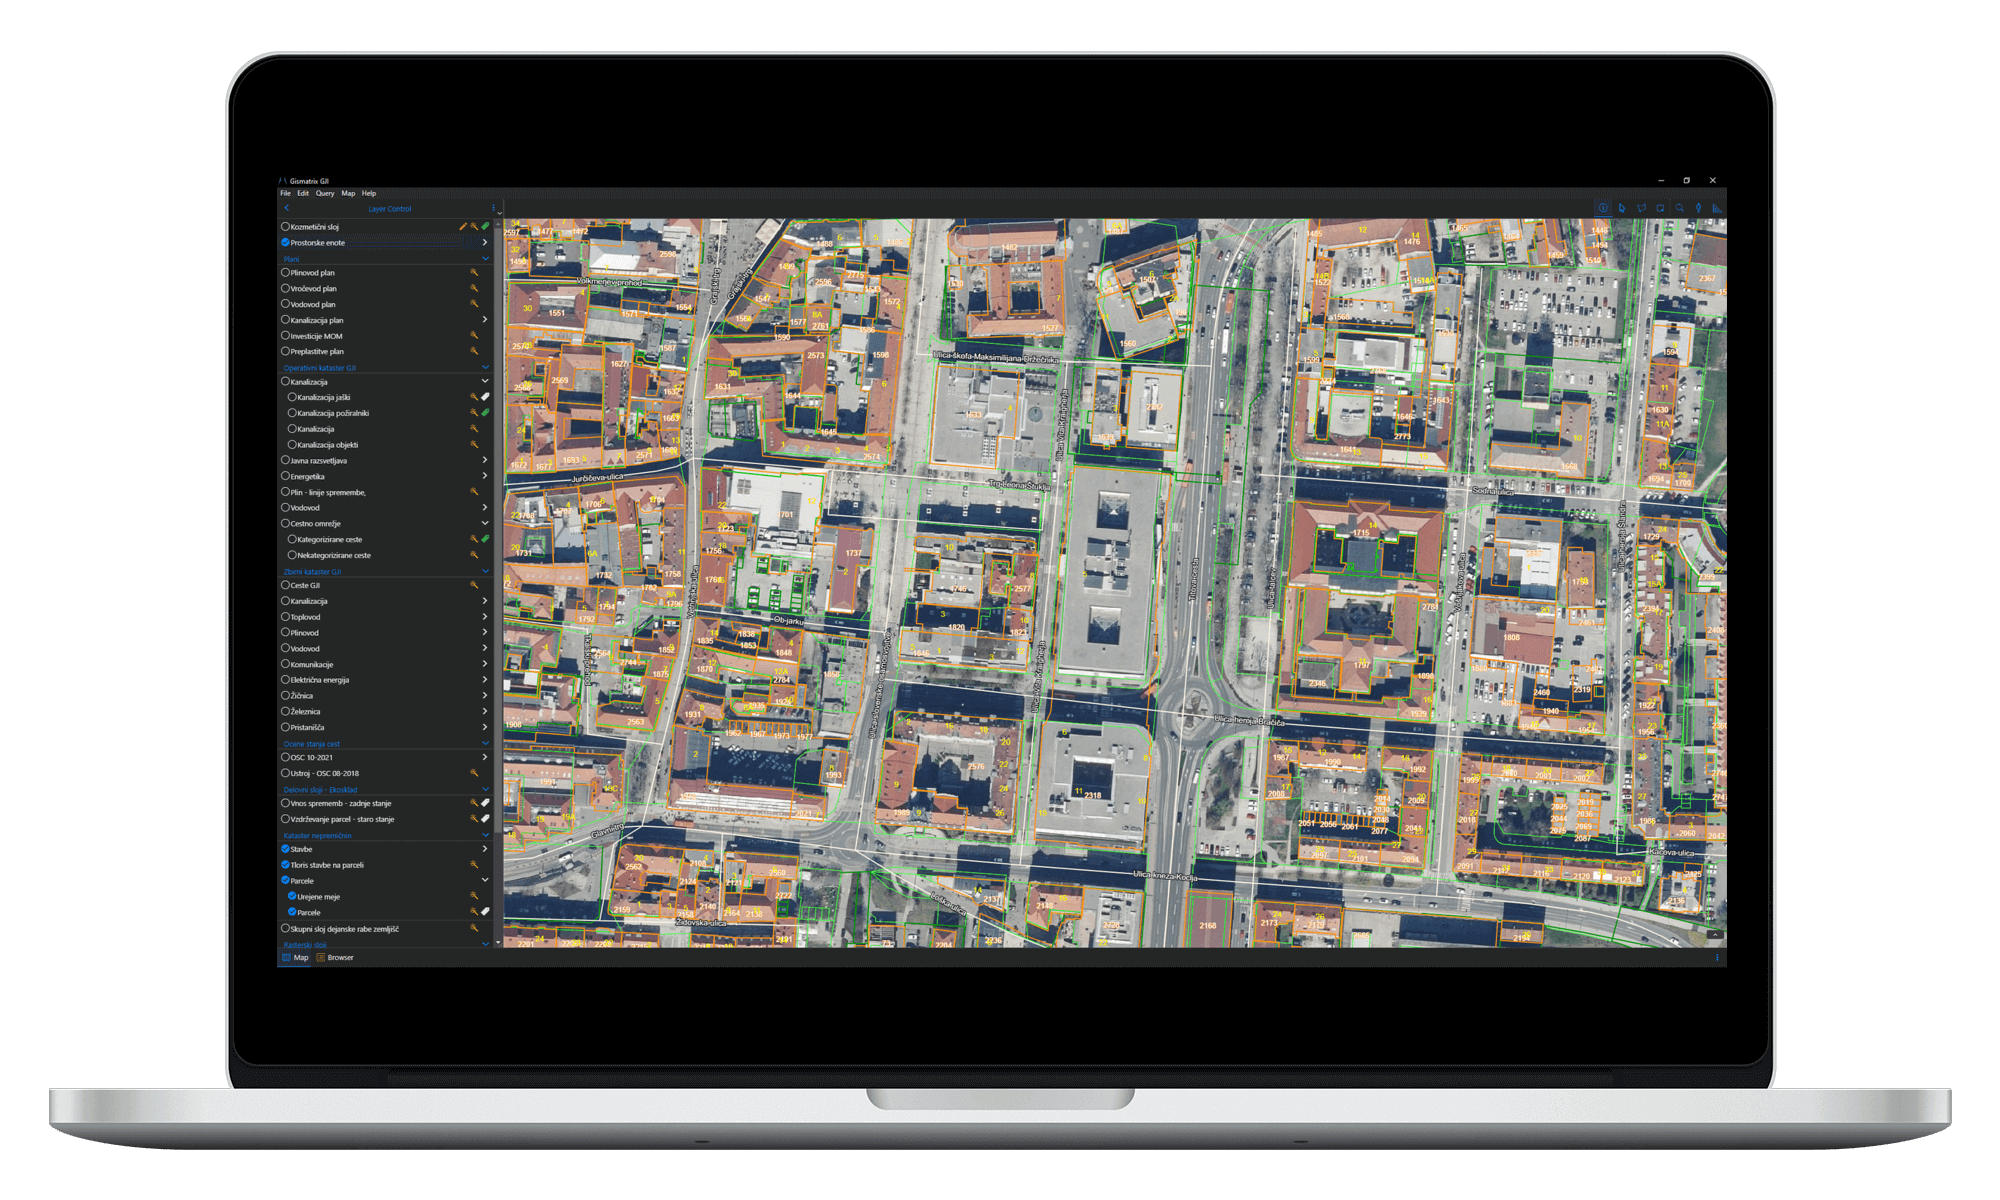
Use it to create maps, analyze data, share and collaborate. It works with or without internet connection. Gismatrix uses your data and maps, which are stored in a secure and private infrastructure and can be configured to meet your cartographic and IT requirements. You can access all of your data in its original form at any time.
Gismatrix runs as a native app on Android, iOS, Windows and macOS. It is designed for phones, tablets and desktop computers.
Functionalities
A map layer(s) can be edited by multiple users simultaneously with or without a web connection.
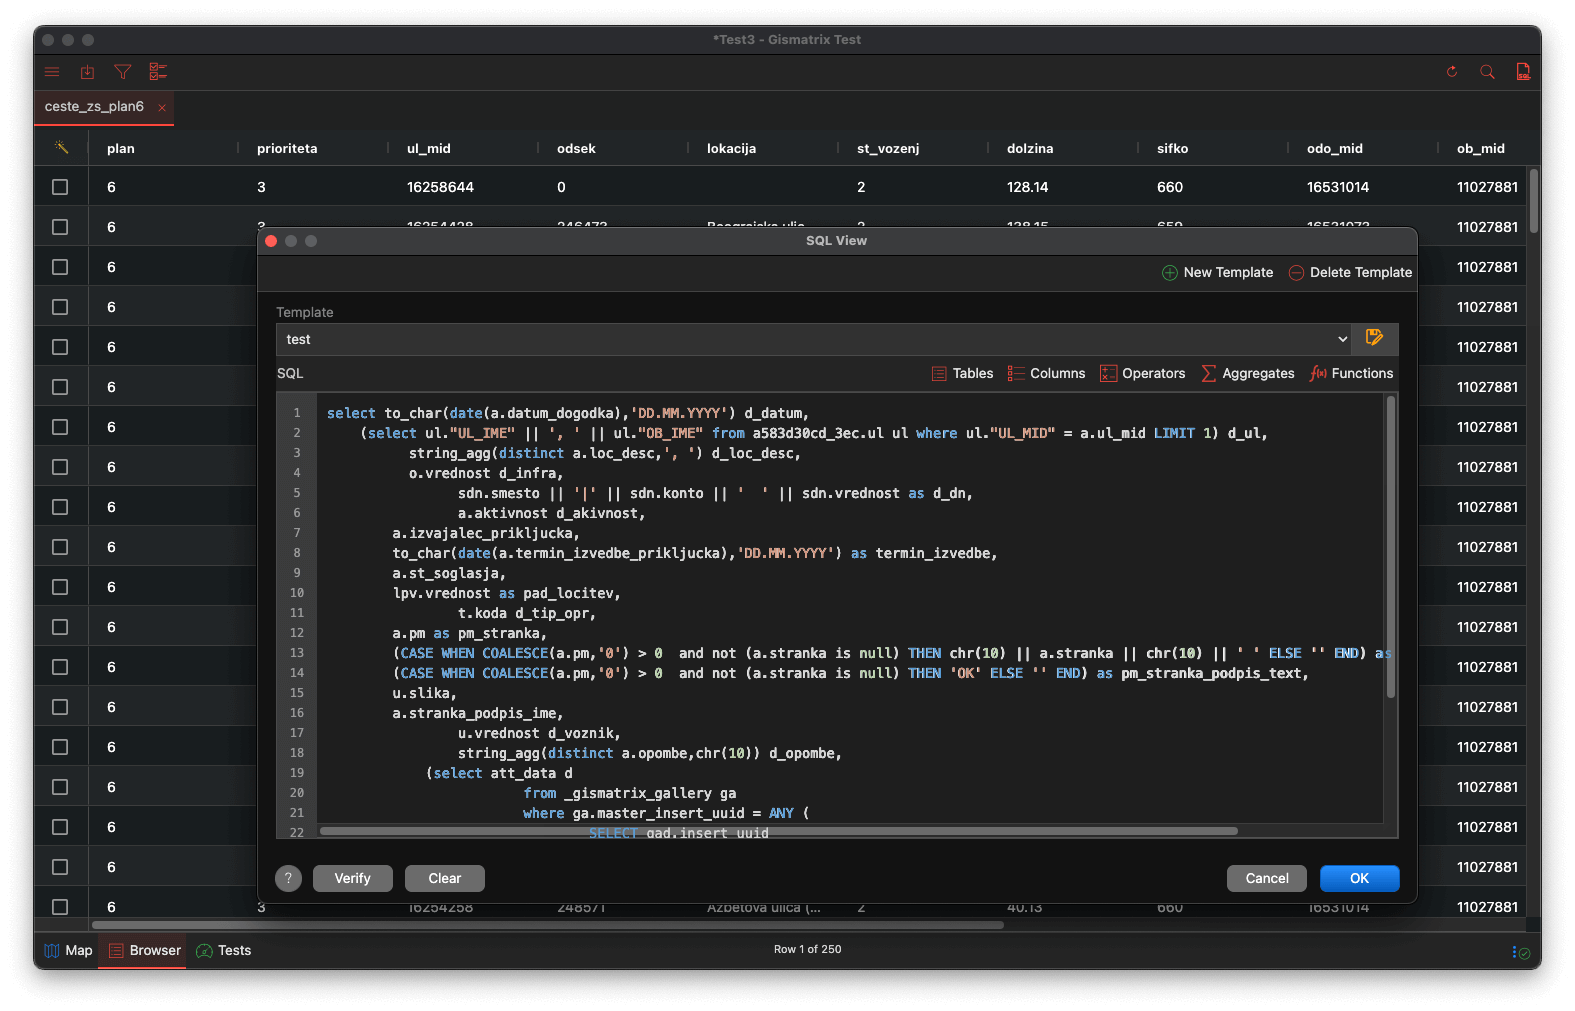
Users may have direct access to GIS tables with Esri, MapInfo, Autodesk and other standard GIS tools. Changes are automatically synchronized with the application.
Editing, analyzing and reviewing
Gismatrix contains everything you need to edit, analyze and view spatial and attribute data. You can ensure geometry and topological compliance with OGC standards for objects that you will create with drawing tools. You can search for and analyze spatial and attribute data using interactive tools and SQL queries. When browsing, you can turn content on or off, tag it, locate it with quick search engines, measure areas and distances, view object attributes, attached documents, photos, videos, 3D models, Lidar- point clouds and a built-in street view to view their appearance in nature.
Infrastructure
With Gismatrix, you will use the same secure infrastructure design, built-in security and global network that Google uses to protect your data, identities, applications and devices.
Data
You can access your data directly or download it at any time in source or in any other standard format or projection. You can use standard types of spatial data and web services that comply with the OGC standard. You can equip cartographic objects with descriptive data, photographs, videos, attachments and 3D point cloud models.
Applications
We can digitize your business processes into dedicated applications that, as plug-ins for the Gismatrix platform, are added to your work environment. You can manage applications independently and enable group editing of spatial data and complex business processes with the possibility of exchanging data with other application solutions, data sources and business entities.
Road Damage Inspections
Road damage inspections are essential for maintaining the safety and quality of transportation infrastructure. They help identify and prioritize the repair and maintenance needs of roads, bridges, tunnels, and other assets. However, road inspections can be costly, time-consuming, and prone to human error. By using Gismatrix for road damage inspections, you can improve decision making, improve asset management and increase operational efficiency.
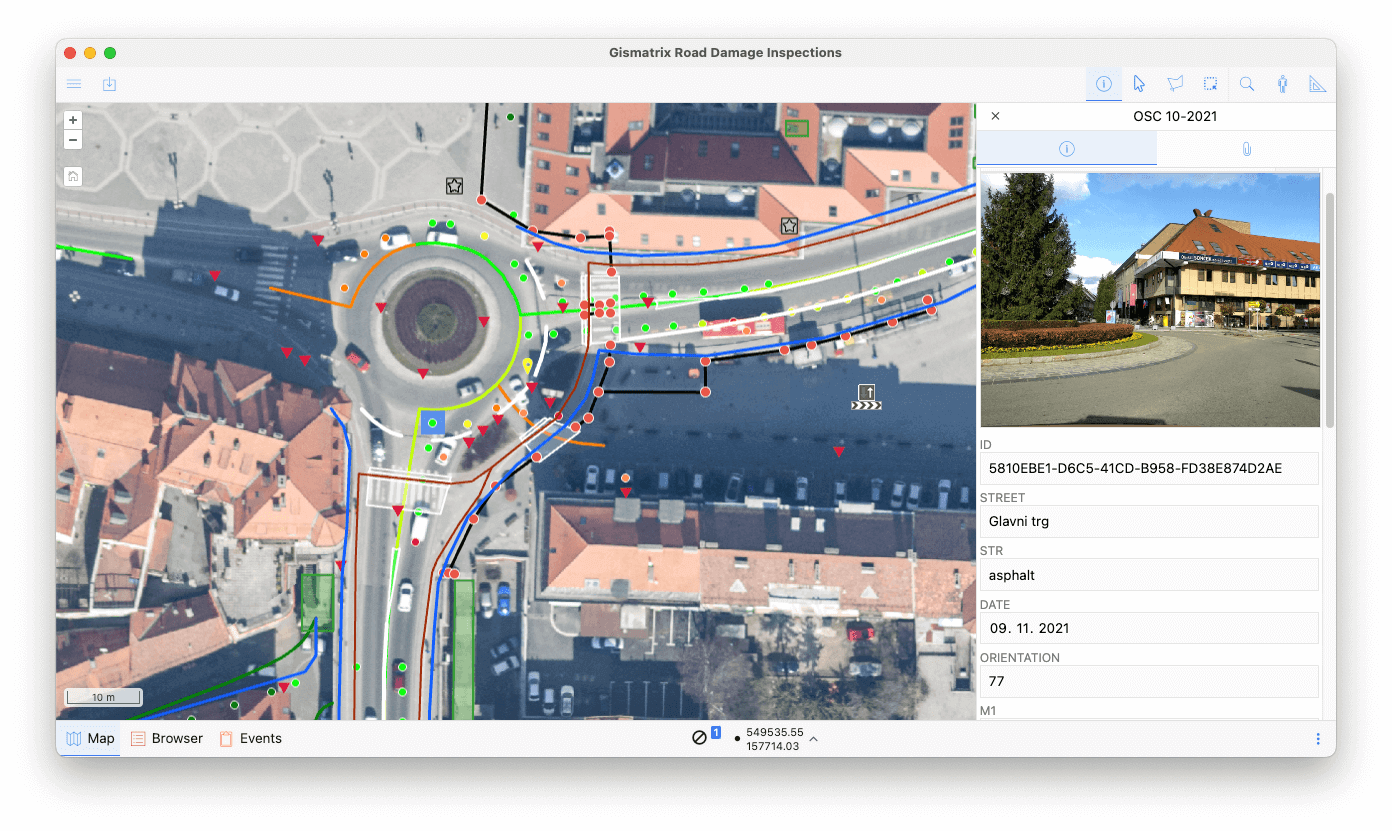
Gismatrix is used to inspect road damage by collecting, processing, and displaying road images with different types of damage, such as cracks, potholes, rutting, and blurring. This help you identify the causes and effects of road damage, as well as prioritize and plan maintenance and repair activities.
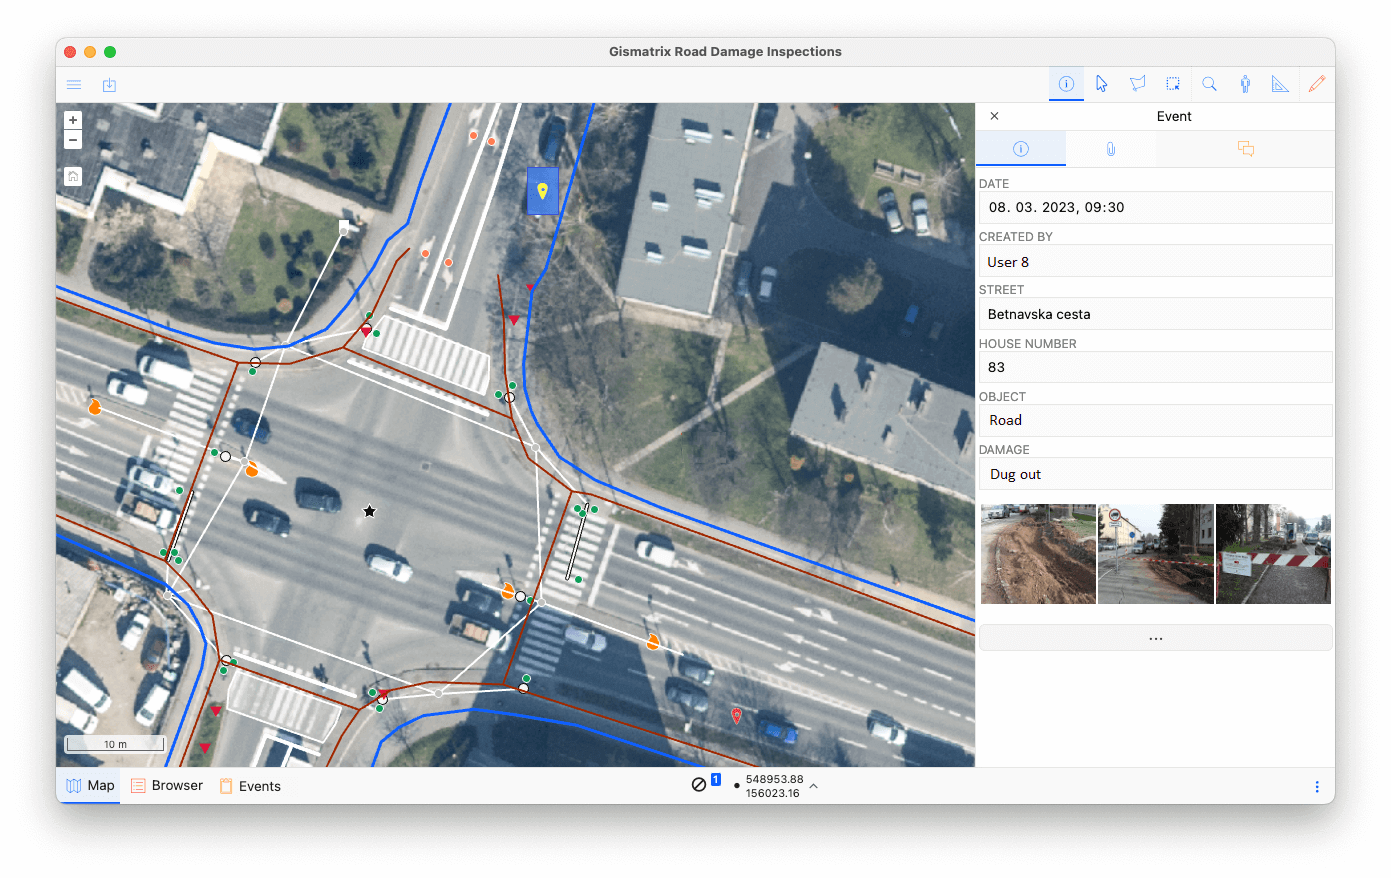
Gismatrix allows you to create road inspection plans, split plans between multiple inspection teams, automatically or targeted detection of faults and events, monitor inspection performance and generate reports and trends. Gismatrix includes different types of data sources, such as satellite imagery, aerial photographs, street imagery, data on road closures, traffic accidents and data from various sensors. It can be linked to a web-based application that allows citizens to report road damages using their smartphones. Gismatrix also provides real-time updates on the status of the reported damages and the actions taken by the road authorities.
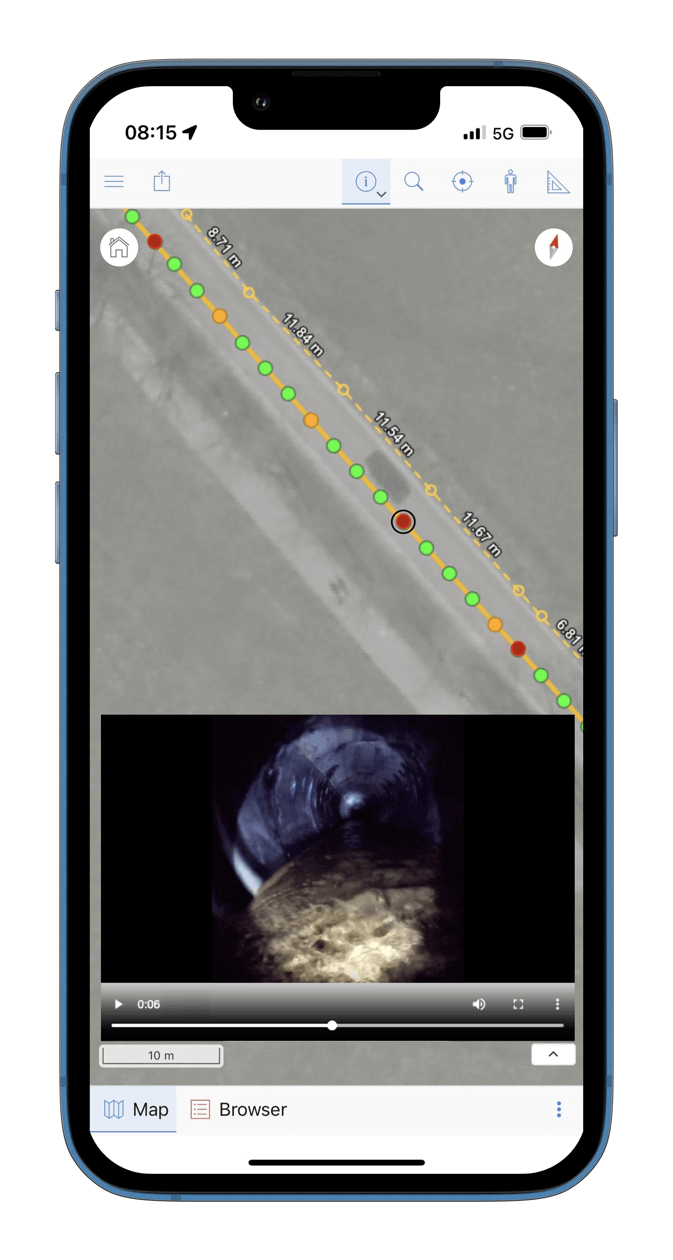
Pipe inspections in flowing water
If you are looking for a reliable and efficient way to inspect your pipelines in flowing water, you might want to consider using a camer. A camera can capture high-quality images and videos of the pipe condition. However, collecting pipe inspection data is not enough. The data also needs to be stored, analyzed and shared in a way that is useful and meaningful for decision making.
The inspections are carried out by capturing video using a device with a built-in camera that travels freely with the flow of water. The device can have sensors that measure the temperature of the medium and the ambient temperature, detect leaks, air pockets, pipe location and magnetic anomalies.
However, collecting pipe inspection data is not enough. The data also needs to be stored, analyzed and shared in a way that is useful and meaningful for decision making. This is where Gismatrix comes in handy. Gismatrix integrates pipe inspection data with other spatial data, such as maps, aerial imagery, topography, land use and environmental factors. This helps you to visualize the spatial distribution and severity of pipe defects, identify potential risks and hotspots, prioritize maintenance and repair actions plan future inspections, as well as to monitor the performance and lifespan of the pipes.
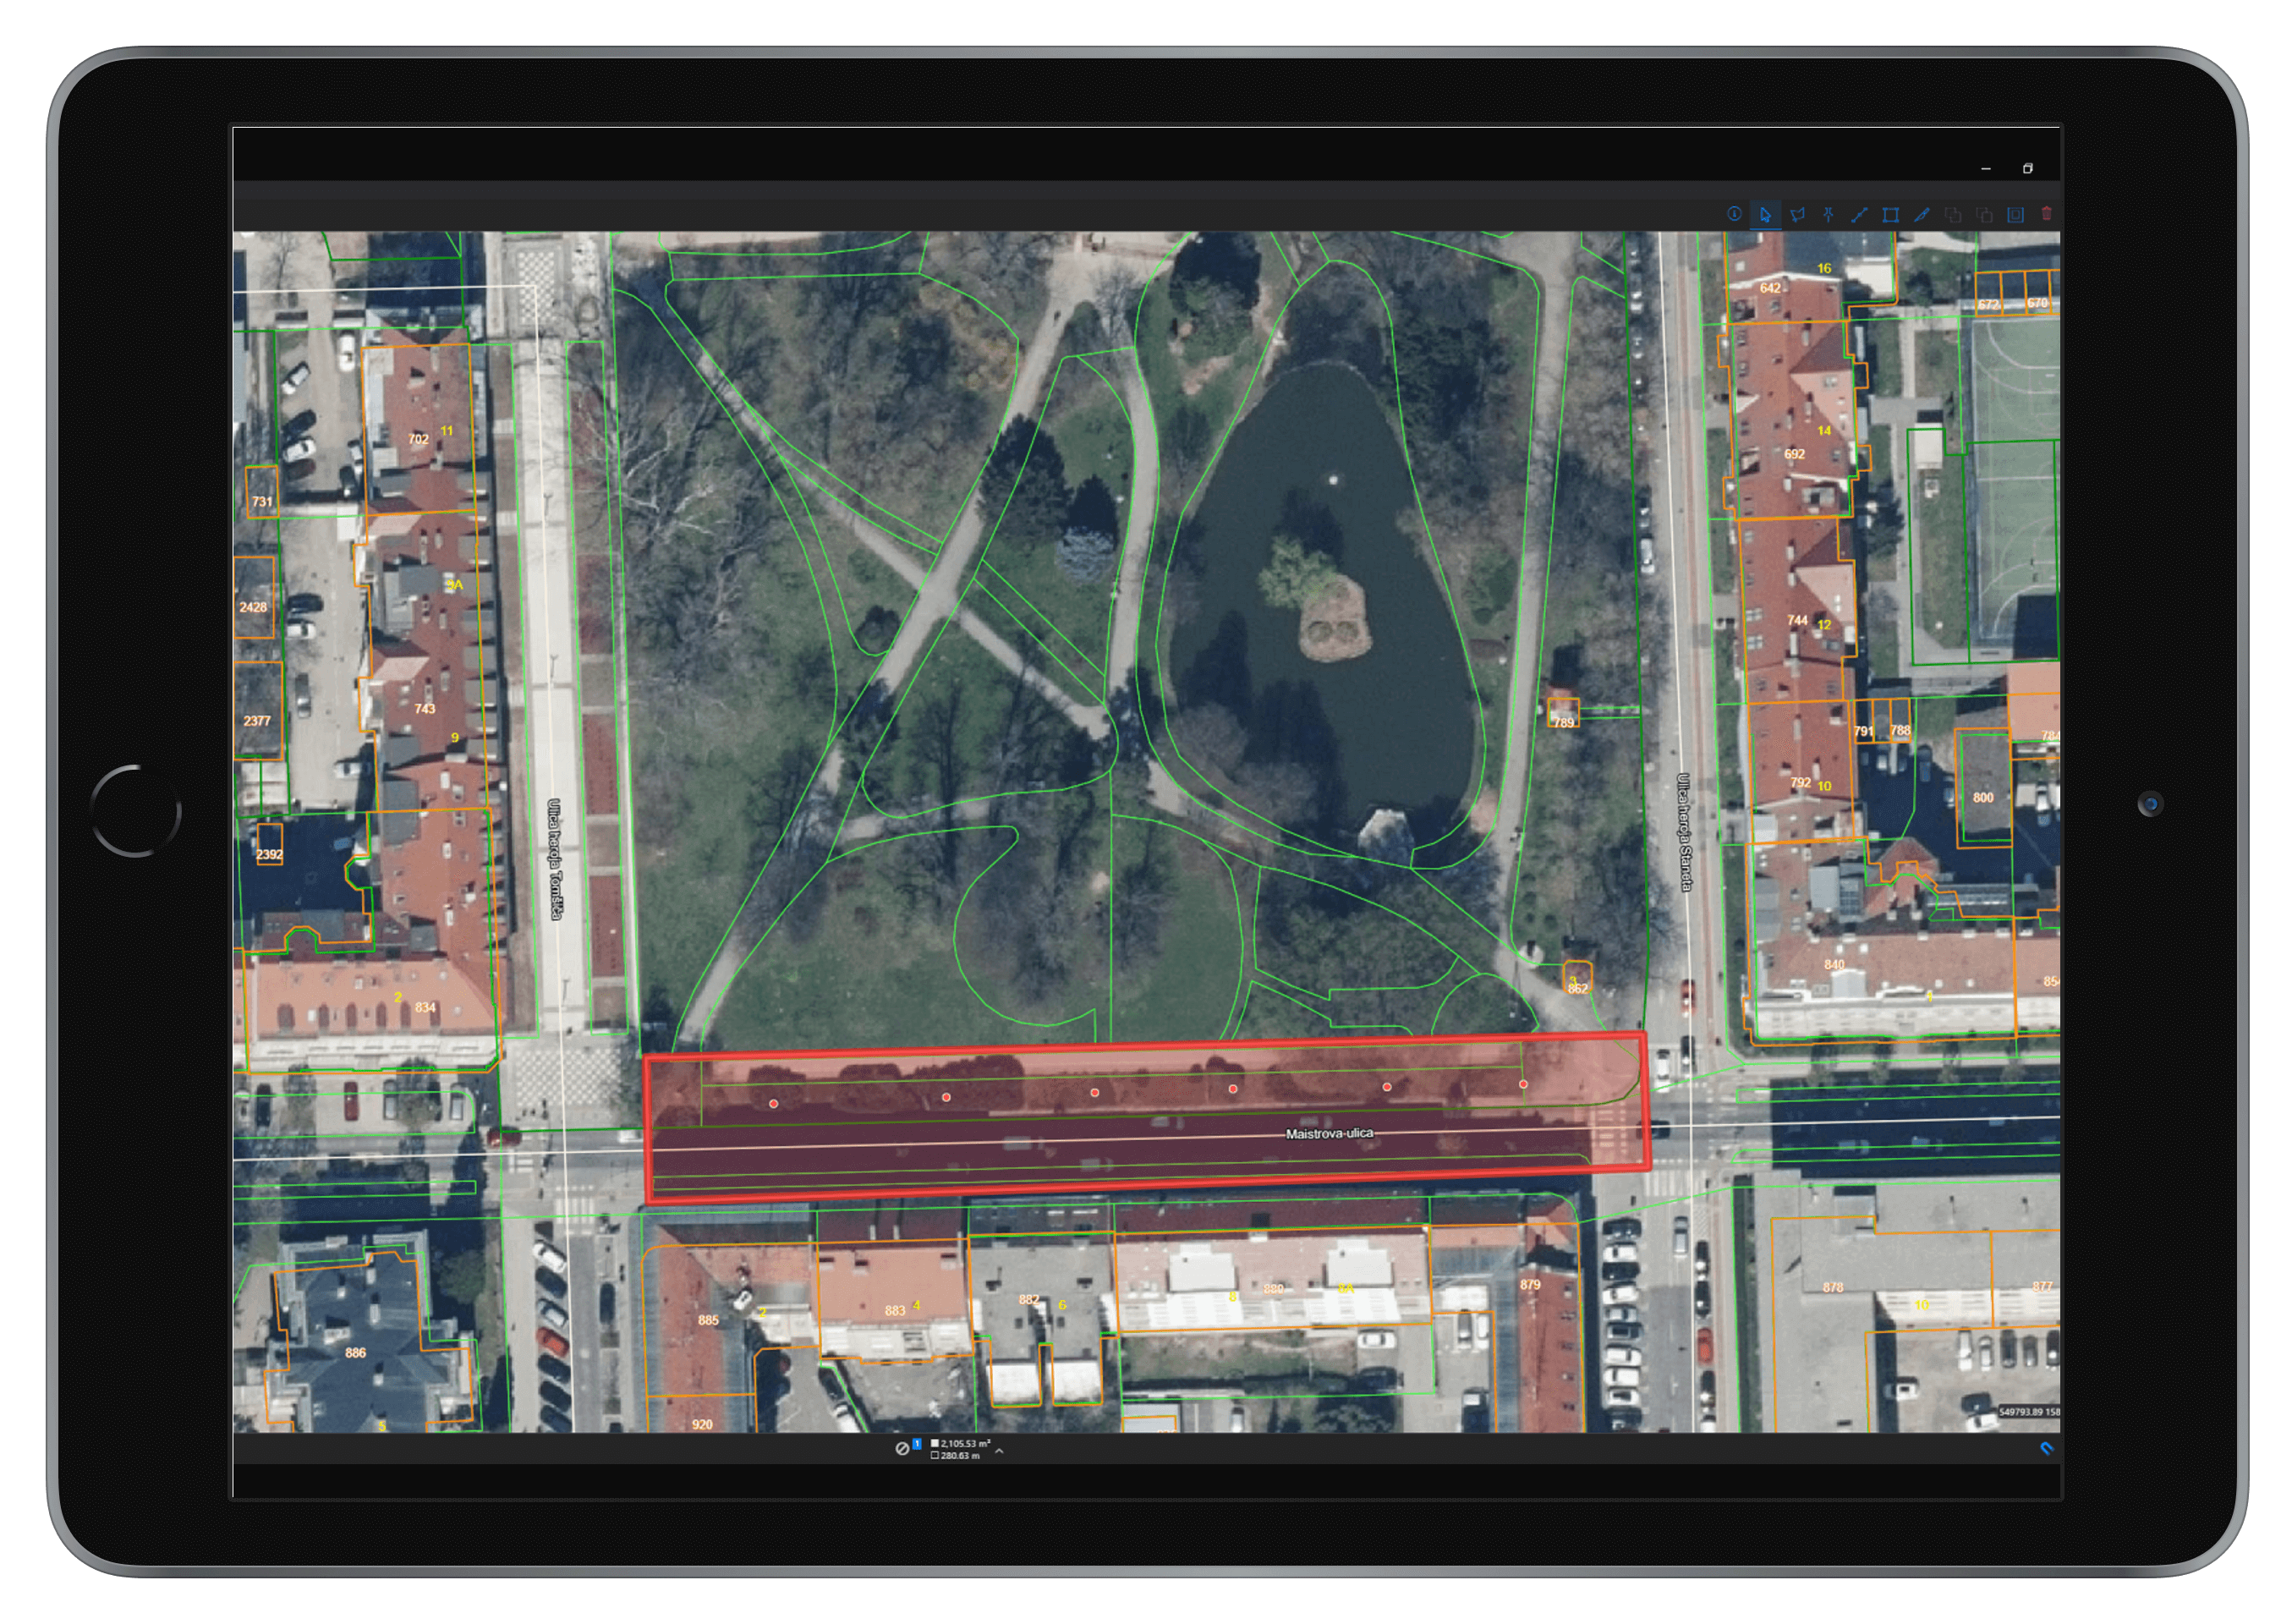
URBAN GREEN SPACE MANAGEMENT
Geographic Information Systems (GIS) are increasingly becoming vital tools in the management of urban green areas. Therefore, the city authorities chose Gismatrix as the most suitable platform for the implementation of the project, which was supported by the EU project 'Urban soil 4 food'.
Gismatrix solution supports sustainable urban planning by allowing for the assessment of vegetation health, maintenance needs, and usage patterns, which is essential for the effective allocation of resources and long-term sustainability of green spaces. Moreover, Gismatrix can aid in creating unified management strategies that enhance the environmental performance of these areas, contributing to the overall quality of life in urban settings.
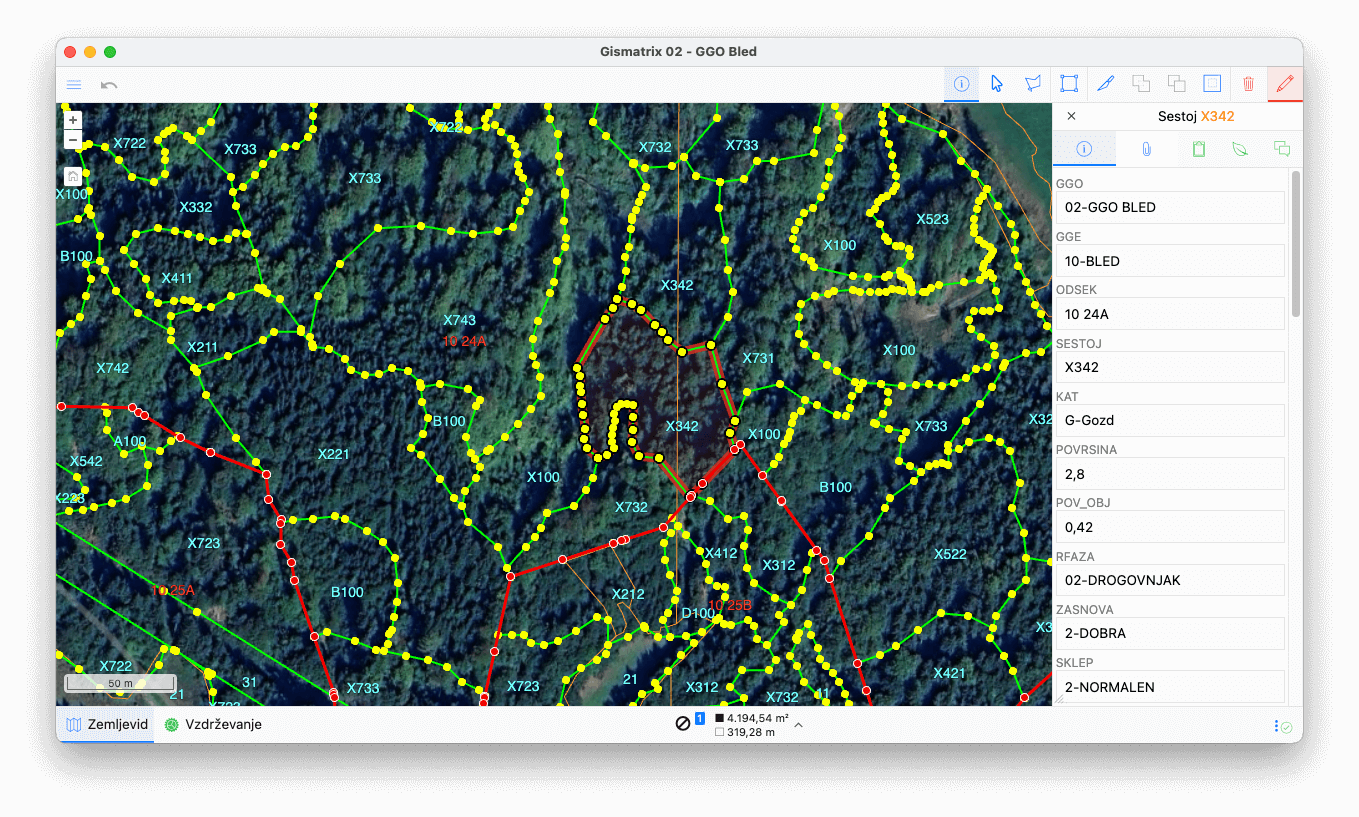
FOREST MANAGEMENT PLANNING AT NATIONAL LEVEL
Gismatrix is used in forest management planning at national level, as it allows the analysis and visualisation of forest data. The plans, which are drawn up by the competent regional units of the Slovenian Forest Service, are the basis for sustainable forest management, taking into account the specificities of individual areas and the needs of forest owners.
Gismatrix enables the monitoring of the state of forests, their development tendencies and the success of past management. On the basis of this data, goals, guidelines and measures for the future period are formulated, which are coordinated with legal procedures and public participation. Data entry and processing in Gismatrix are key steps for providing quality information, which is necessary for effective forest management planning. After input, typically on mobile devices without a internet connection, the data are topologically and attribute-checked and organized in GIS, which enables their easy use and updating.
ROADBLOCK MANAGEMENT
Geographic Information Systems (GIS) are increasingly becoming an essential tool in managing roadblocks and ensuring efficient traffic flow. The Gismatrix application implements processes from planning to the removal of roadblocks. Planned and current road closures are publicly available via the GIS website.
The process of managing road closures with GIS support involves several steps to ensure efficient and effective communication and management. Initially, an employee in the public works department receives plans for streets that require closure. Using Gismatrix they draw the closures on the map, place roadblocks, and identify detour routes. Field teams equipped with Gismatrix on mobile devices set up the roadblock and document the process in real-time. As situations change, such as extended closure dates, the information is updated in real-time within the Gismatrix.
